This is the last of three articles about emu_ns, the emulator of the North Star Advantage. Part 1 described the machine and the core, and Part 2 the disks. Here I cover the tools for looking inside a running program, the serial board, copy and paste, and the ESP32 version.
The debugger
To understand what a program does on the Advantage, I wanted to stop it and look. The debugger opens in its own window from the menu of the emulator page.
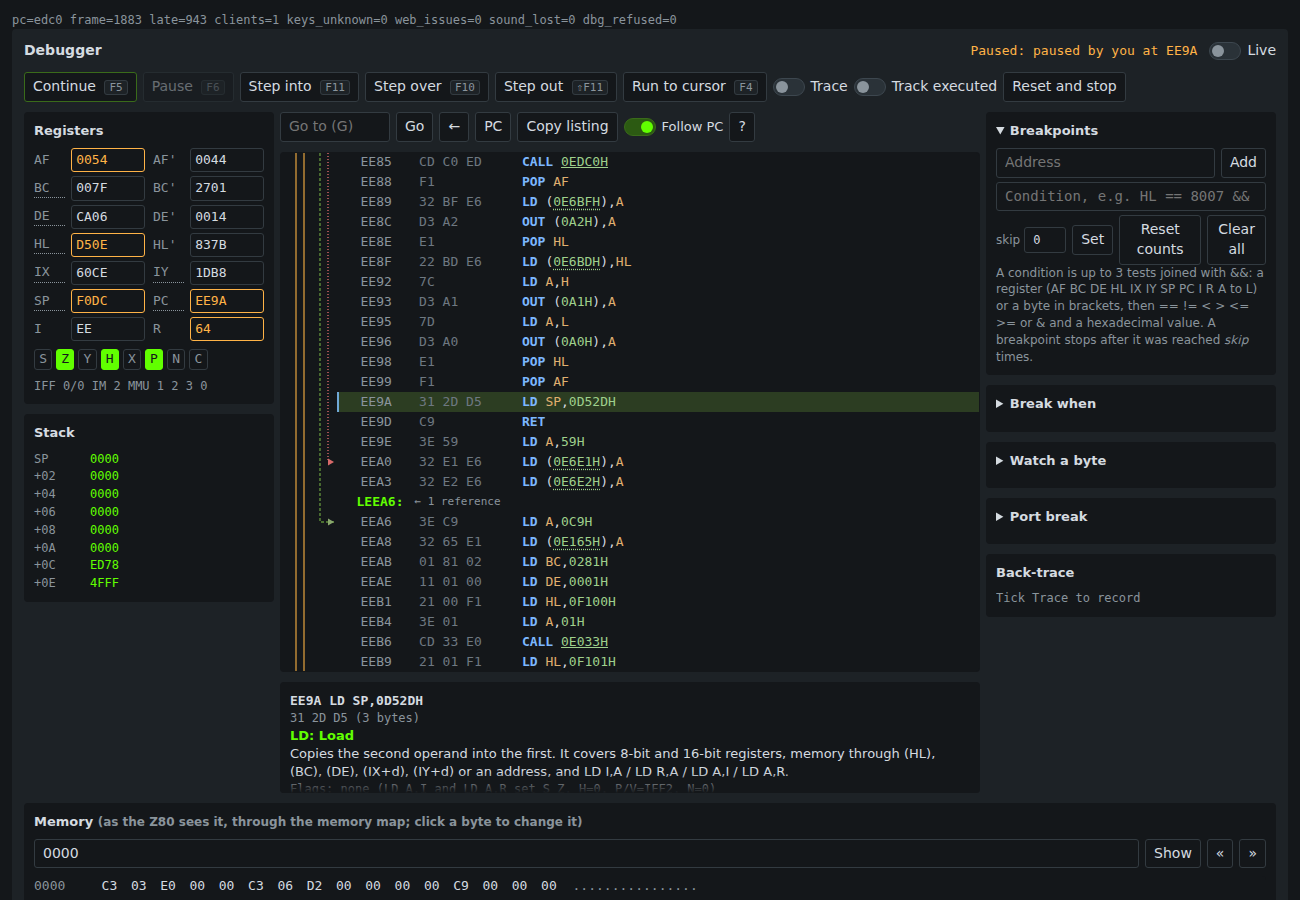
It has Continue (F5), Pause (F6), Step into (F11), Step over (F10), Step out (Shift+F11), Run to cursor (F4) and Reset and stop. It shows the registers and flags (editable while the machine is paused), the stack, a disassembly listing with labels and jump arrows, and a memory view over the whole 64 KB, where a click on a byte changes it. A click on a memory operand such as (HL) or (0E6BFH) shows that address in the memory view.
The design rule is that the fast path must not change. The emulator runs a frame with no per-instruction code, and the debugger switches to a slow path, one instruction at a time, only while something needs it: a breakpoint, a watch, a step, Trace or Track executed. A test runs 150 frames of the PROM both ways and checks the same cycles, speaker events and RAM.
What the debugger can do:
- Breakpoints with conditions, up to three tests joined with
&&, such asHL == 8007 && [C100] != 0 && A & 80. A test is a register or a byte of memory against a hexadecimal value. A breakpoint also has a skip count and a hit count. - Break when: a condition checked after every instruction, wherever the PC is. It stops when the condition goes from false to true, because a level trigger would stop at every instruction while it stays true.
- Watches on a byte and port breaks. A stop says which instruction wrote the byte, or which one accessed the port and what byte went through it.
- Live: the registers and the listing follow the PC while the machine runs, about 10 times a second. The PC shown is a sample, so the status says LIVE in orange to avoid mistaking it for the real one.
- Trace: a back-trace of the last executed addresses. Track executed turns the address of each instruction that has run green in the listing.
- Search for text or hex bytes in the memory the Z80 sees now, and a Strings list.
- Cross-references: a label row says how many lines use that address, and the Explain panel lists them. The emulator has no program image, so it only searches the lines in the listing.
- Copy listing copies the loaded lines as text.
The disassembler decodes from the bit fields of the opcodes, with no tables. Its instruction lengths are checked against the Z80 core for 1,153 opcode sequences, and it reports the flow of each instruction (jump, call, return and so on), which draws the arrows. As on the x86, a Z80 instruction cannot be decoded backwards. The lines before an address come from the farthest start that decodes without invalid bytes and ends exactly at the address, because a nearer start can fall inside an instruction.
The debugger from the command line
I added dbg.py, a command line client that speaks the same protocol over the WebSocket, so a script (or another computer) can debug a running emulator:
dbg.py pause
dbg.py break add 8300 --if "HL == 8007"
dbg.py wait stop
dbg.py mem 8007 16
dbg.py screen
dbg.py load prog.com --go
It reads the symbol file of z80asm -L, so addresses have names. It can take a screenshot, press special keys, wait for memory, screen text or a number of frames, and run a script of commands in one connection. load puts a CP/M .COM file into memory at 0100 with the stack the CCP would give it, and runs it. That gives a quick loop to load and test a program without a floppy. The port has no password, so it is meant for a network you trust.
Copy and paste
The screen is a bitmap, so Copy reads the text back from the picture. Every program I looked at draws its text in cells of 8 by 10 pixels with the font of the boot PROM, seven bytes for each character, so each cell is matched exactly with that font. A solid block is the cursor and becomes a space, and anything that is not a glyph becomes ?, and the page says how many cells that was. The four boot screens read back with no cell left over. Drag a rectangle over the screen to copy only a part. Copy image puts the screen on the clipboard as a PNG at twice its size.
Paste has its own difficulty. The Advantage keyboard holds 7 keys and drops the rest, so sending a text at once would lose characters whenever the guest is busy. The emulator keeps the text and gives the guest one key at a time, only when the keyboard buffer is empty. The pace is the guest’s own, and a 36-character text reaches a CP/M prompt whole.
The serial board
The Advantage has slots for a serial board, which I emulate as a uPD8251 in slot 1. Its line goes to a terminal window in the browser: what the guest sends appears there, and what you type goes to the guest. A few details come from the data sheet where the reference emulator does not follow it, such as the framing error bit. The receiver is paced: the chip holds one received byte, and the emulator gives it the next one only when the guest has read the last, at the speed of the line. A paste then arrives at the baud rate and nothing overruns.
An ESP32 board
The reason for the portable core was this: the whole emulator runs on an ESP32 board. It serves the same pages over Wi-Fi, and reads the disk images from an SD card.
The hardware is simple: a classic ESP32 DevKit, a 0.96-inch OLED, a microSD module and an RS-232 level converter.
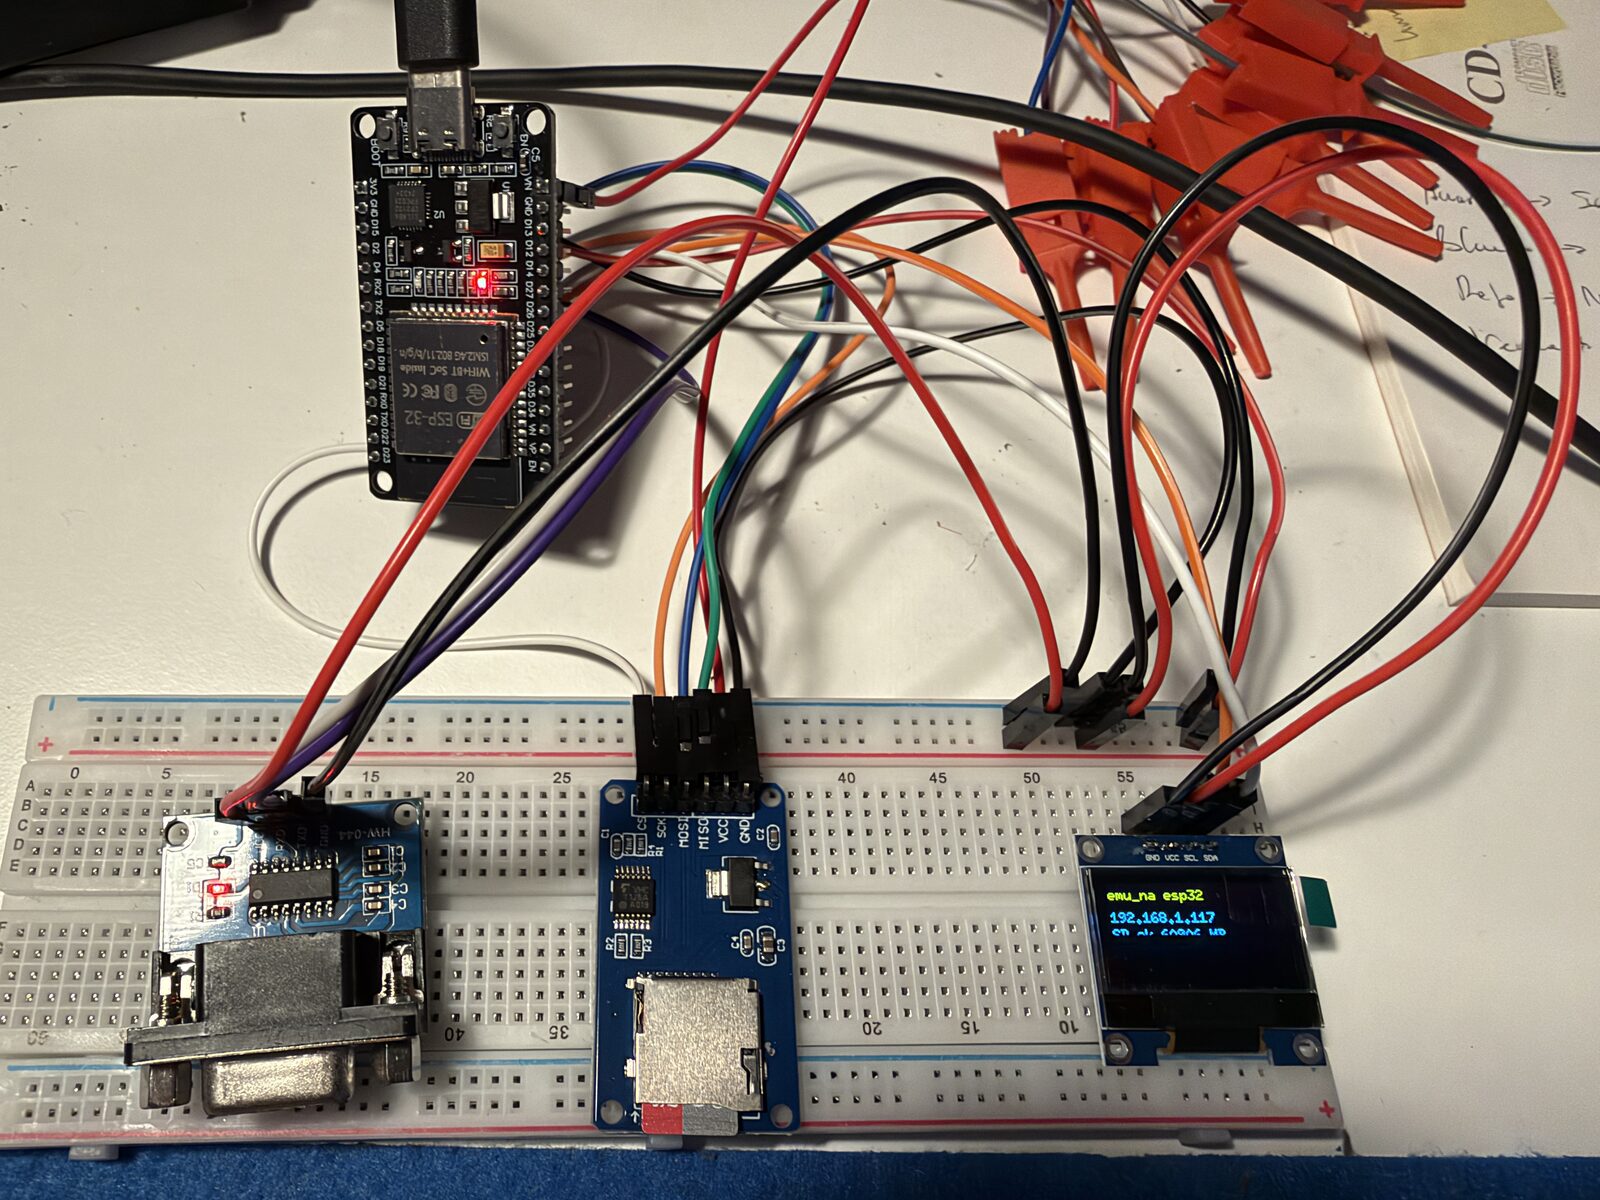 The OLED shows the IP address and a few status lines. There is a catch with the OLED: a full redraw takes about 25 ms over I²C, more than a frame has to spare, so a line is drawn only when its text changes. The SD card must be FAT32, and its SPI clock is 4 MHz, because 20 MHz fails with jumper wires and 10 MHz worked only some of the time.
The real challenge is memory. The board has no PSRAM, and the heap is 242 KB at start. The emulator state takes 105 KB, the SD driver 28 KB and Wi-Fi 47 KB, and that leaves about 45 KB for the web server, and under traffic the largest free block can be 7 KB. So the server keeps small queues and never asks for a big block:
- a picture is sent in messages of 12 rows, built as the socket takes them, and only when the checksum of video memory changed;
- static files are streamed in 1 KB pieces, and a page is loaded one file at a time, up to three connections;
- the RAM parity circuit needs 8 KB more than the largest free block, so it is switched off on the board;
- the disk list is refreshed every 15 seconds and only while a page is connected.
I test this in two ways. make test-esp32 runs the same tests on the PC with the limits of the board (three connection slots, small queues, a picture sent in rows). It cannot run out of memory, so it finds mistakes in that code, not shortages. make test-board runs against the real board over Wi-Fi: it loads every page, drives the debugger, mounts a floppy from the card, boots CP/M, copies the screen as text and pastes DIR. It does not always pass: loading the five files of the debugger window at once while the screen runs can take the free heap down to about 5 KB, and about half of the runs pass.
The serial board is wired to the RS-232 module. I had one bug that I enjoyed: the module’s pin labels are from the microcontroller’s side, so the pin it calls TXD is an input. The first firmware had the two wires the wrong way round. I found it by releasing the UART and reading each pin as an input with the pull-up and pull-down on: a pin that keeps its level is driven by the module, and a pin that follows the pull is floating. The same test tells swapped wires on a new module. The wire is not yet tried with a real device.
With the 30 MB image of CP/M software on the card, the board boots CP/M, and DIR lists the hard disk.
Where it stands
Everything described in these three articles works on Linux, in the browser and, with the limits above, on the ESP32. The source code is not public yet. You can run the emulator at emuns.romheat.net, and the disk images are in the public emu_ns-disks repository.